Browser
Ephemeral CEF browser session with URL bar, navigation, and tab management - no resource to save.
Features
- Chromium (CEF) browser with native performance
- Session cookies persist while the tab is open
- Drag-drop image export from any page
- Inspector and DOM cutout for overlaying web UI
The Browser is a full-featured Chromium-based browser built into RightPlace. It uses the CEF (Chromium Embedded Framework) engine for rendering and provides navigation, developer tools, element inspection, screenshot capture, and responsive previews.
The Browser is a utility applet, not a saved applet. It is opened from Places and each tab runs its own ephemeral session. To save a collection of URLs as a persistent applet, use Website instead.
Opening a Browser
Open a browser from a Place. In the Places sidebar, expand a project and click the Browser tab at the top of the Place page. This opens a browser scoped to that Place with its own session.
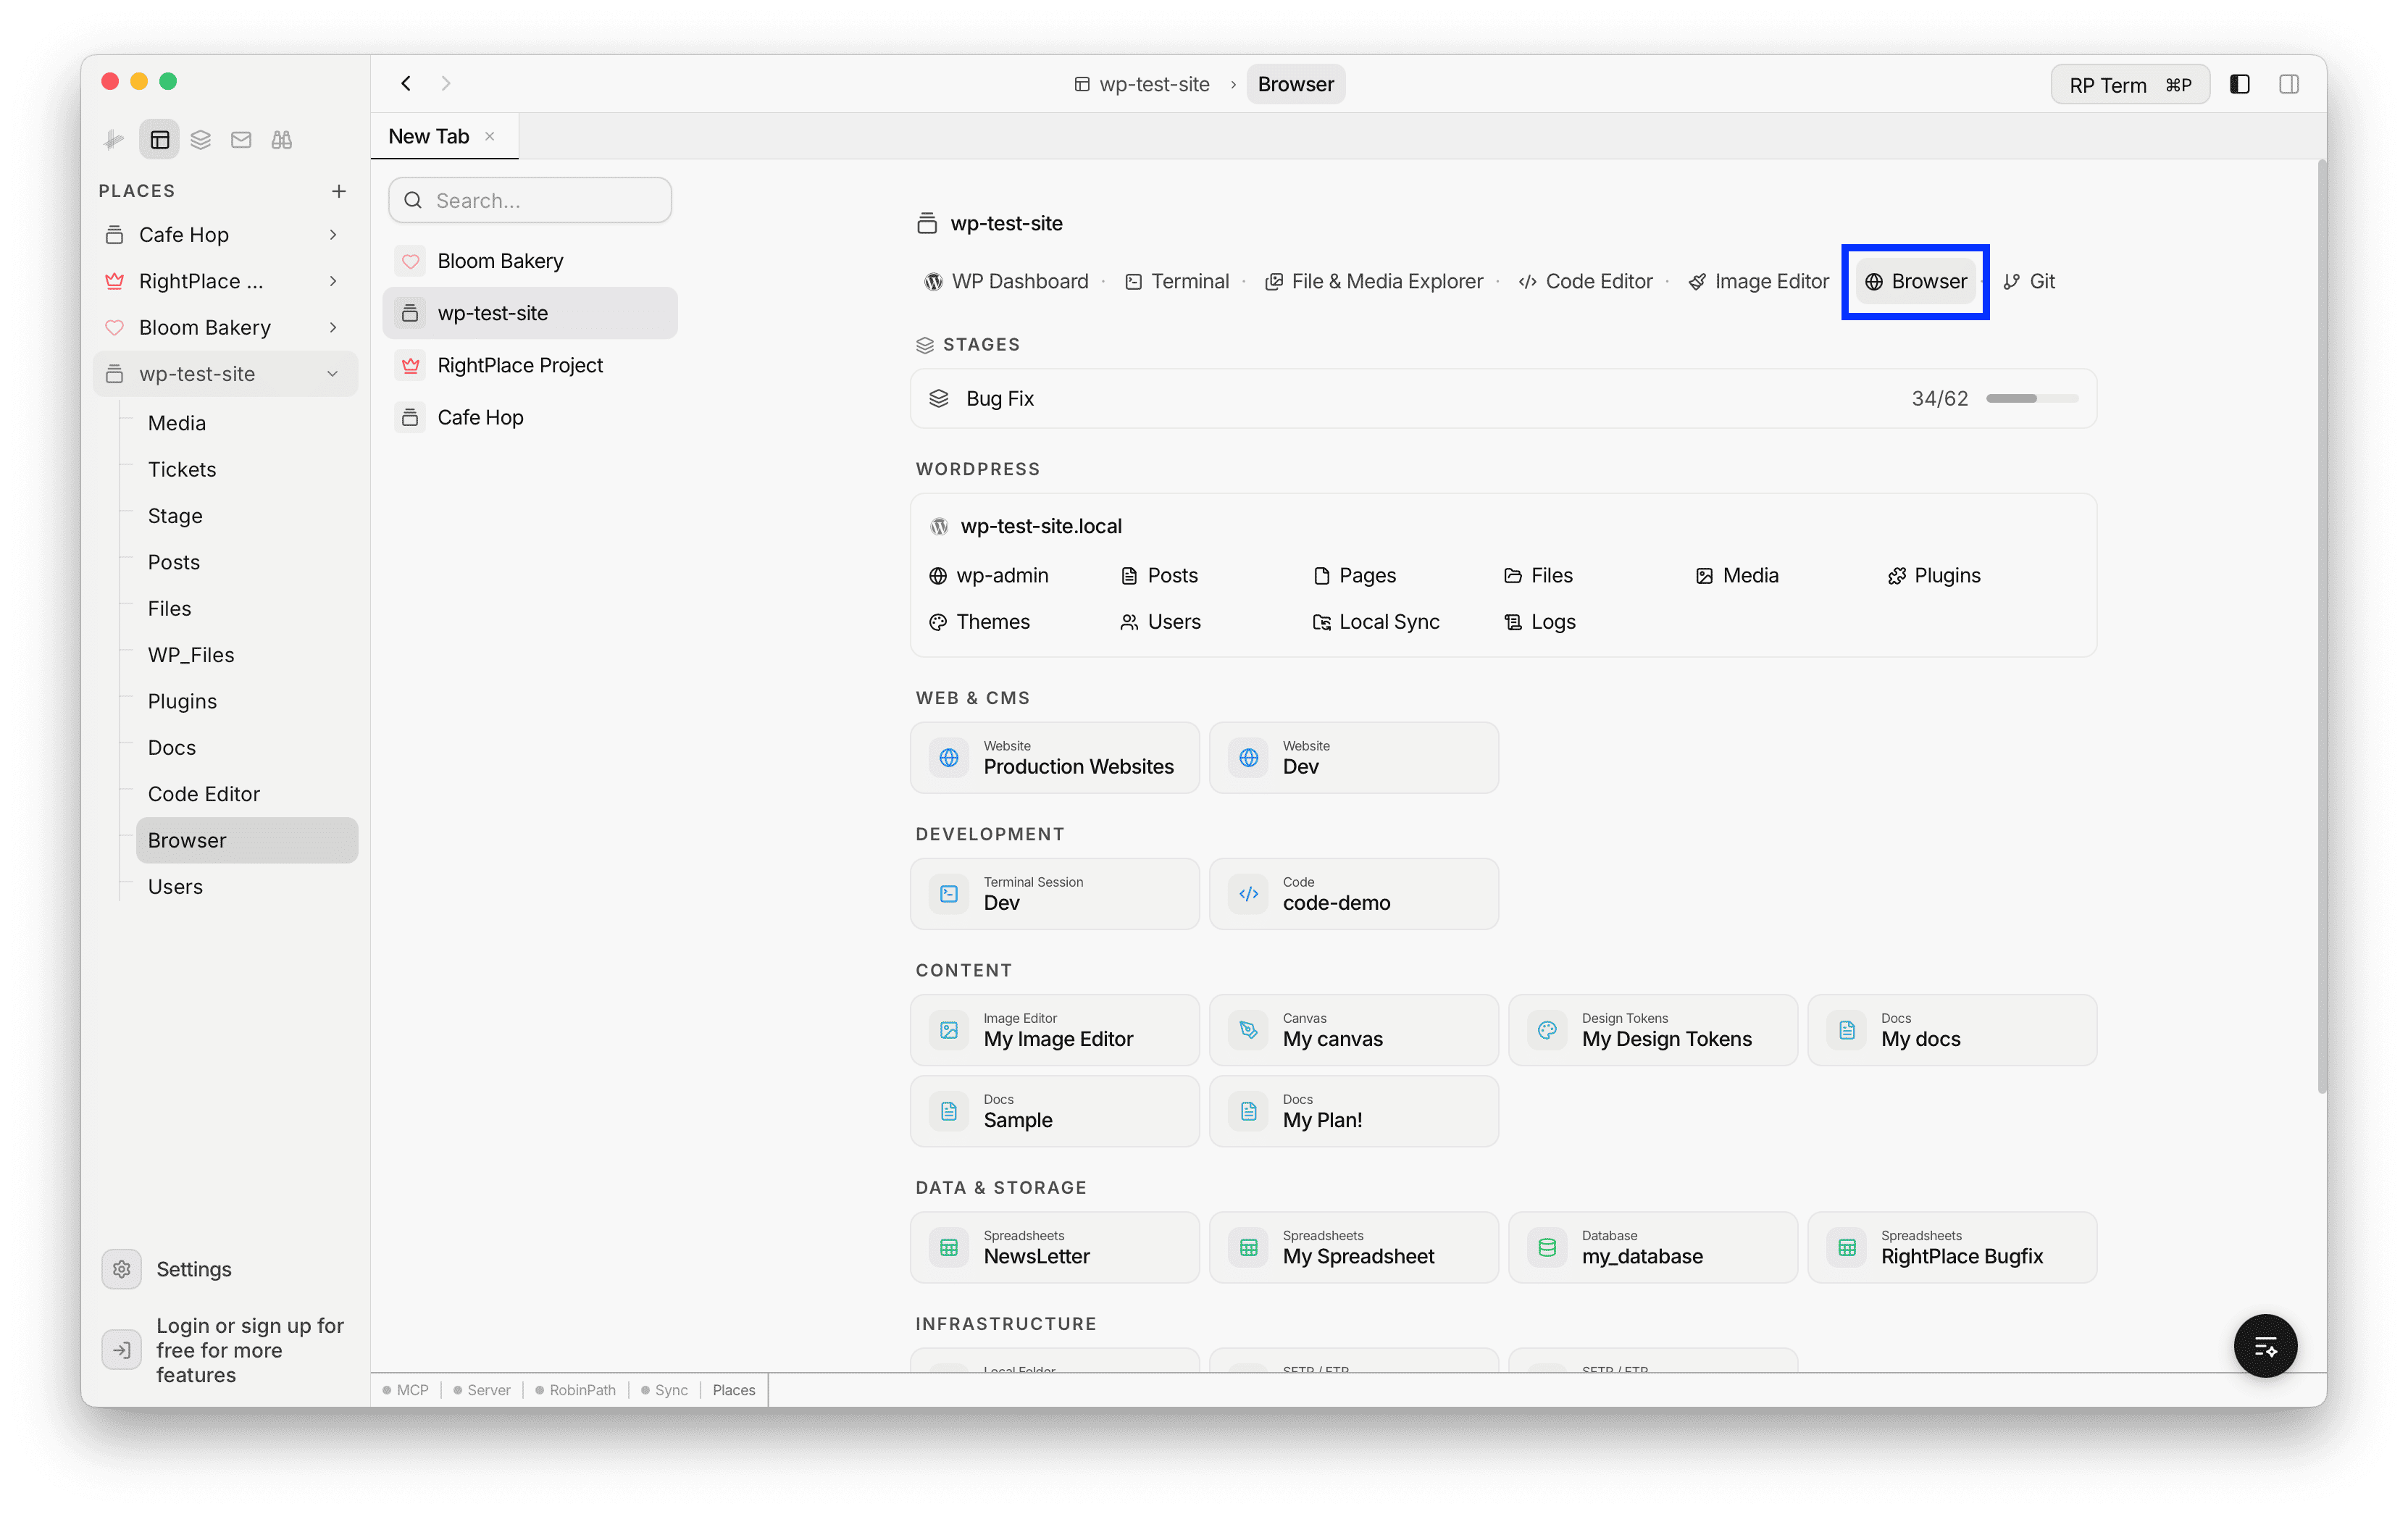
Each browser session is tied to the Place it was opened from. Sessions persist across app restarts, so you return to the same page, scroll position, and zoom level.
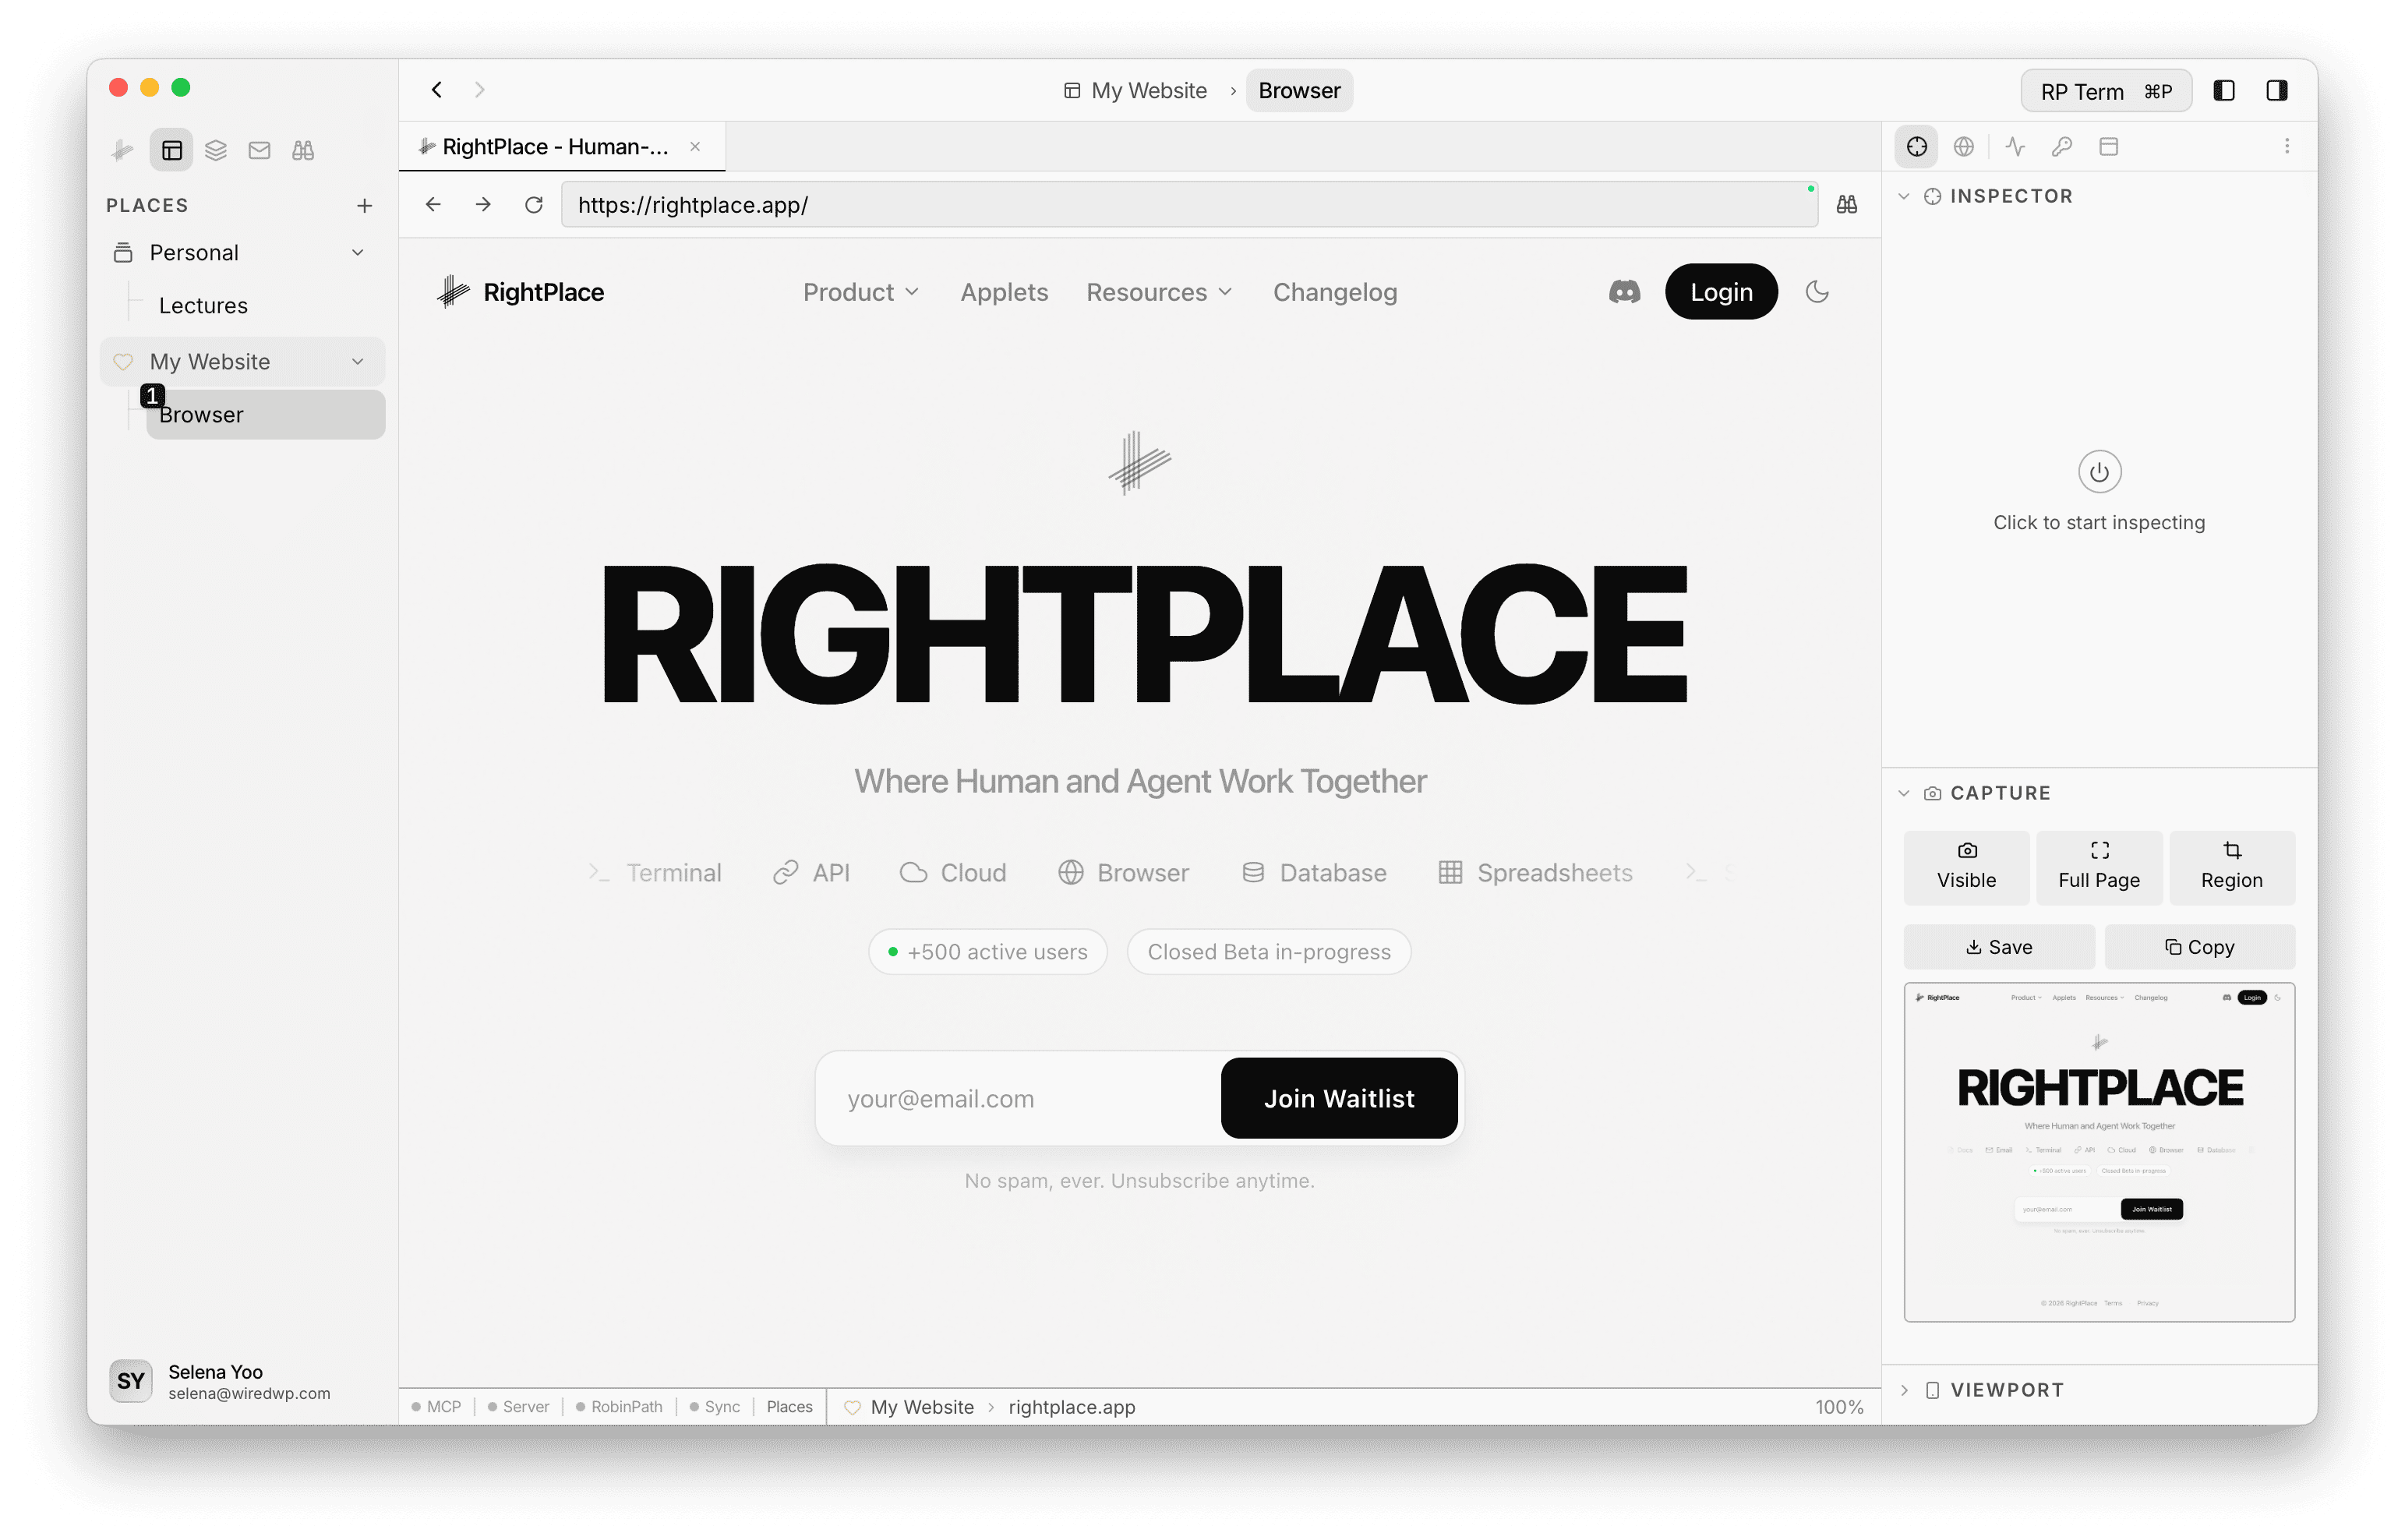
Browser Interface
The browser layout consists of:
- Top toolbar: navigation buttons (back, forward, reload), address bar, and action buttons (find, downloads, settings)
- Content area: the rendered web page
- Loading indicator: a progress bar at the bottom of the address bar during page loads
Navigation Controls
The top toolbar provides standard navigation:
- Back (
Cmd+[orAlt+Left): go to the previous page in history - Forward (
Cmd+]orAlt+Right): go to the next page in history - Reload (
Cmd+R): reload the current page - Hard Reload (
Cmd+Shift+R): reload the page and bypass the cache - Stop (shown while loading): cancel the current page load
The address bar shows a colored status dot: green when the browser tab is focused, yellow when unfocused.
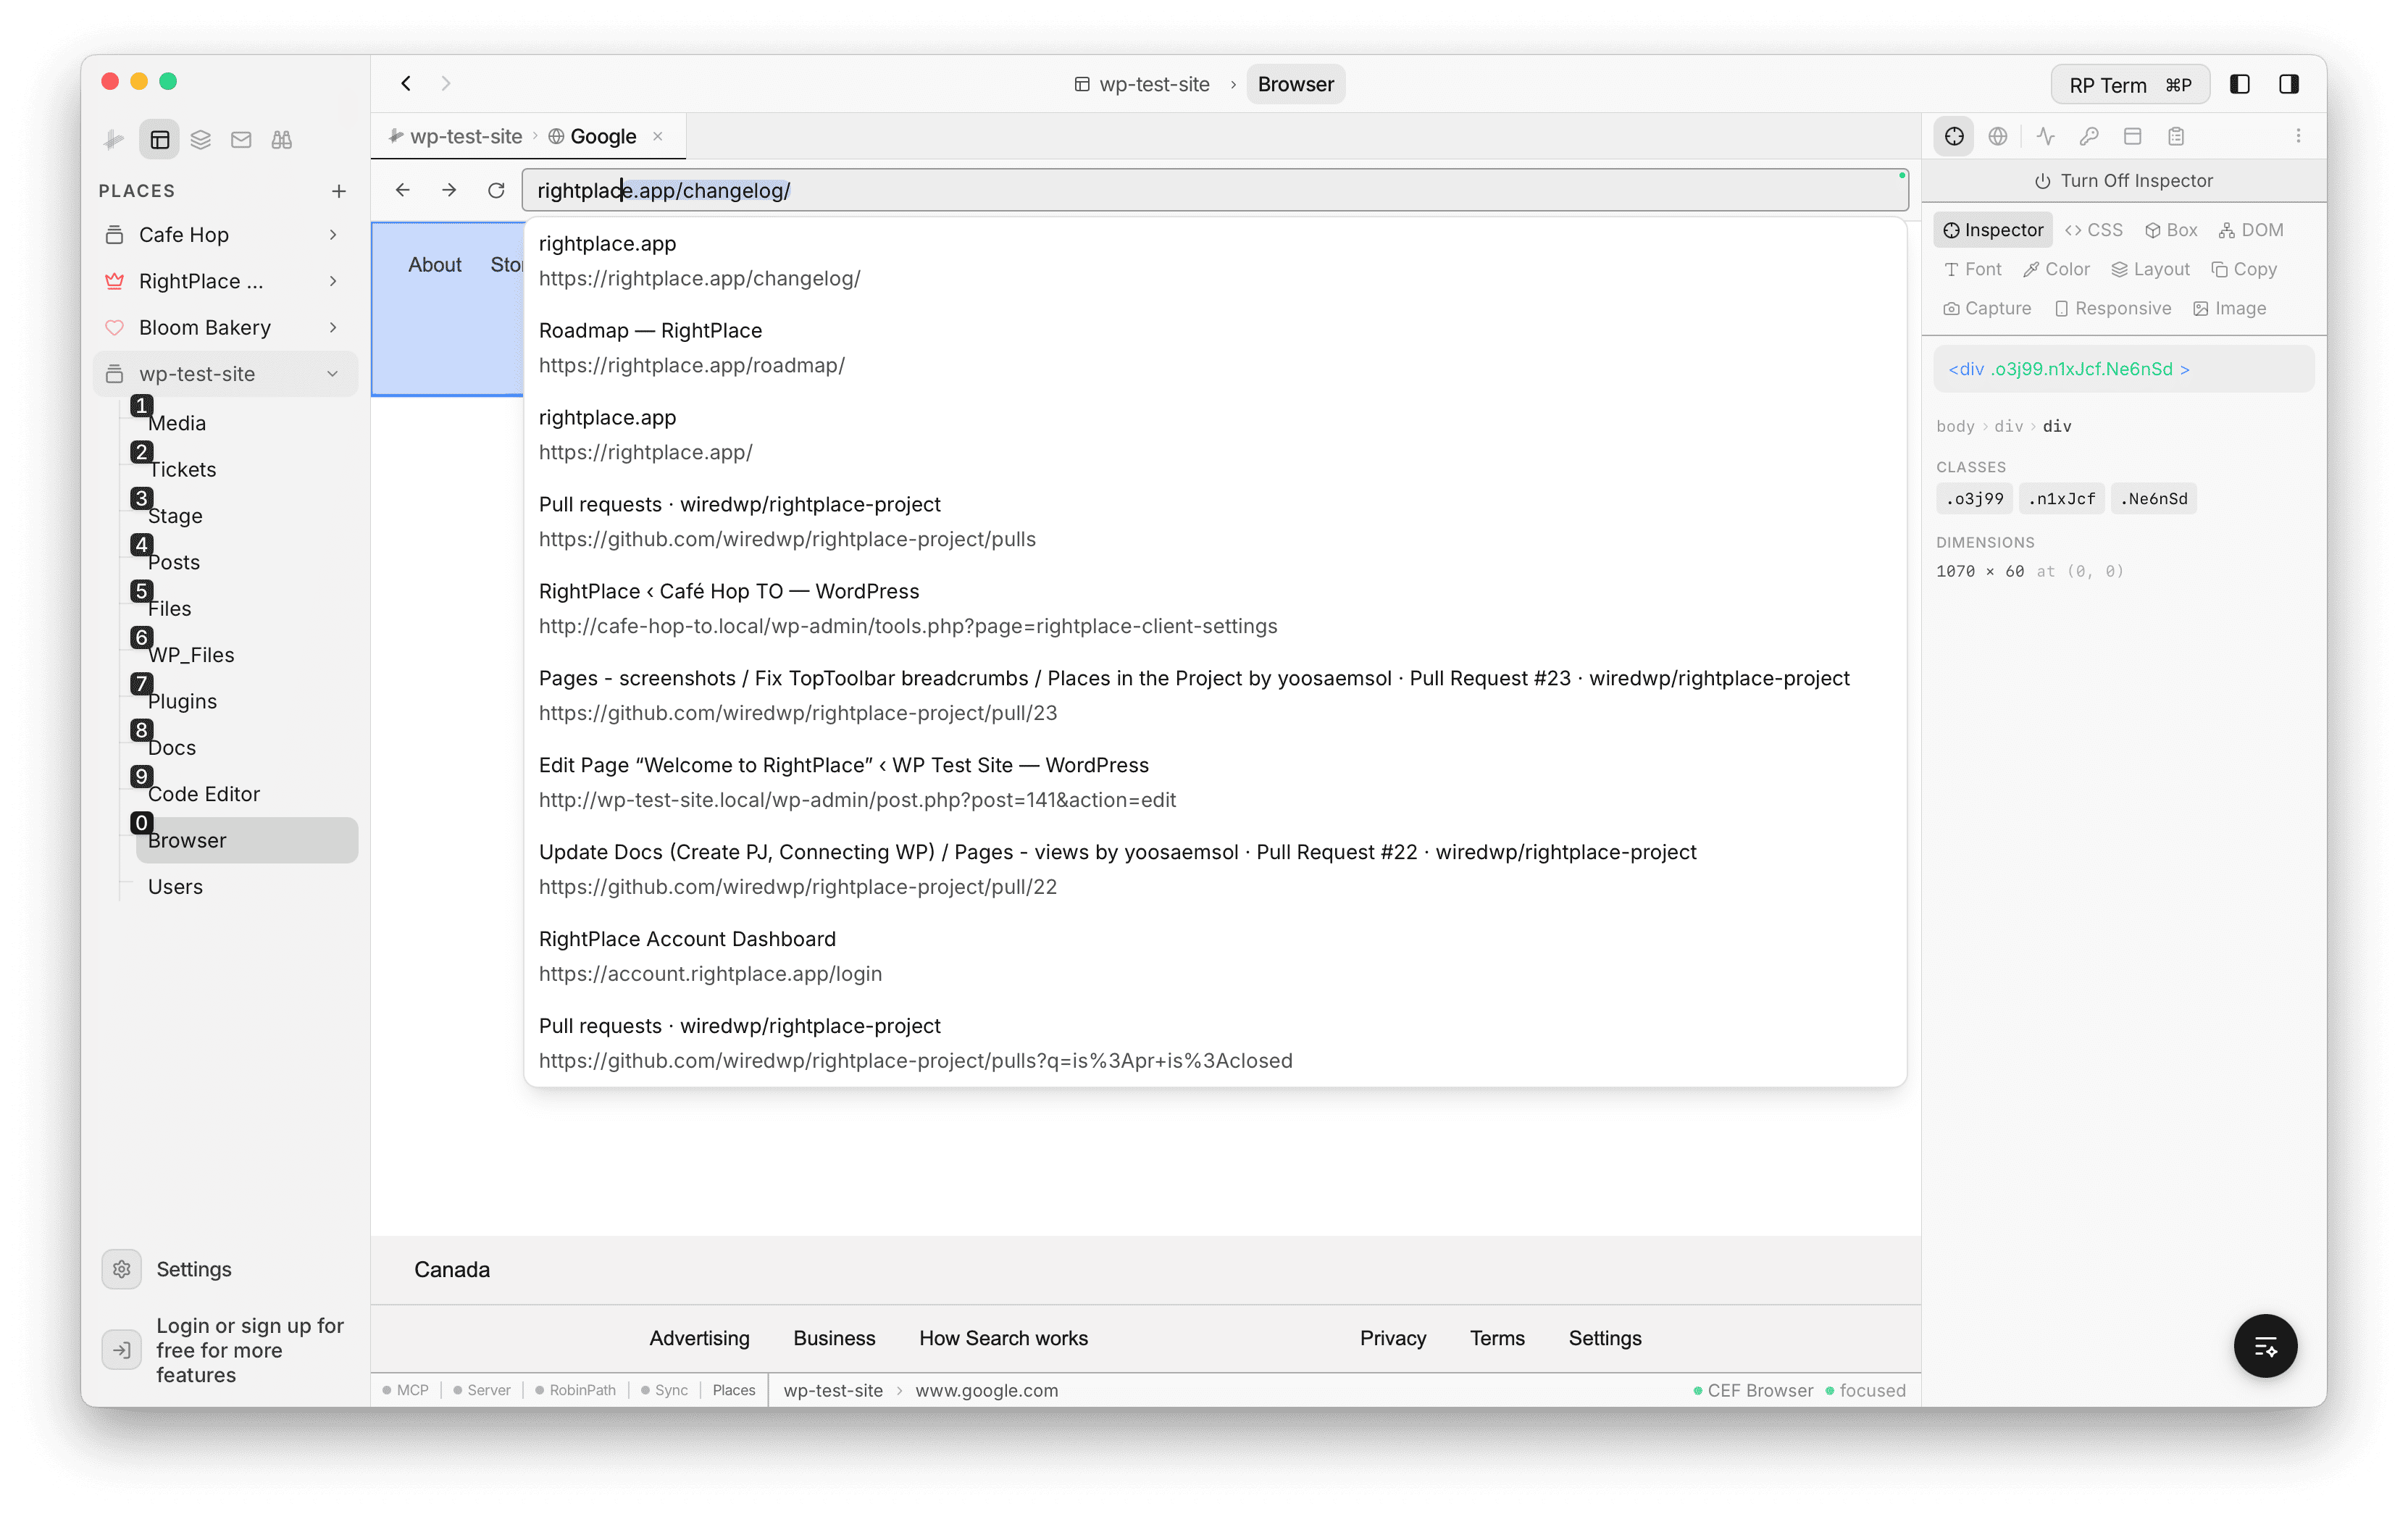
Address Bar
The address bar supports smart URL detection and search:
- URL detection: typing a domain-like string (e.g.
example.com) auto-addshttps://. Localhost and IP addresses gethttp://. - Search fallback: non-URL input is sent as a Google search query.
- Focus: press Cmd+L to jump to the address bar from anywhere.
As you type, the browser suggests pages from your browsing history:
- Dropdown suggestions: up to 10 matching results, filtered by URL and title
- Ghost hint: a completion suggestion appears in lighter text overlaid on the input. Press Tab to accept it.
- Keyboard navigation: Arrow Up/Down to move through suggestions, Enter to navigate, Escape to close
Find in Page
Press Cmd+F to activate find in page. The search bar replaces the address bar and shows match highlighting across the page.
- Match counter: displays “X of Y” or “0 results”
- Navigate matches: Enter or Cmd+G for next match, Shift+Enter or Cmd+Shift+G for previous match
- Highlighting: matched text is highlighted in bright yellow
- Exit: press Escape or click the close button
Developer Tools
Press Cmd+Alt+I to open the Chromium DevTools in a separate window. This gives you full access to the Elements panel, Console, Network inspector, Sources, Performance profiler, and all other standard Chrome DevTools features.
You can also open DevTools by right-clicking the page and selecting Inspect Element from the context menu.
Context Menu
Right-click anywhere on a page to access the context menu with these options:
- Reload: reload the current page
- Hard Reload: force reload, bypassing cache
- Copy Page URL: copy the current URL to the clipboard
- Open in Default Browser: open the URL in your system browser
- Inspect Element: open Chromium DevTools focused on the clicked element
- RightPlace Inspector: activate the built-in RightPlace inspector on the clicked element
- Save Image As: save an image from the page (available when right-clicking an image)
Downloads
When a file download begins, a download indicator appears in the toolbar. Click it to open a popdown with download details:
- Active downloads: filename, progress bar, percentage, and file size with a cancel button
- Completed downloads: filename and size with options to Open the file or Show in Folder
- Clear all: remove all completed downloads from the list
Browser Settings
Access browser settings from the settings icon in the toolbar or from the global Settings page.
Home URL
Set the default page that opens for new browser tabs. Defaults to https://google.com.
Sessions
View and manage all browser tab sessions:
- Session details include state, URL, place, scroll position, zoom level, and timestamps
- Filter sessions by place
- Delete individual sessions
Browsing History
Browse and search your full browsing history:
- Search: filter by URL or title
- Paginated list: 20 entries per page, most recent first
- Visit count: shows how many times each page has been visited
- Delete: remove individual entries or clear all history
Keyboard Shortcuts
| Shortcut | Action |
|---|---|
| Cmd+L | Focus address bar |
| Cmd+F | Find in page |
| Cmd+G | Next find match |
| Cmd+Shift+G | Previous find match |
| Cmd+R | Reload |
| Cmd+Shift+R | Hard reload (bypass cache) |
| Cmd+[ or Alt+Left | Back |
| Cmd+] or Alt+Right | Forward |
| Cmd+= | Zoom in |
| Cmd+- | Zoom out |
| Cmd+0 | Reset zoom to 100% |
| Cmd+Alt+I | Open DevTools |
| Cmd+Shift+C | Toggle inspector pick mode |
| Tab | Accept address bar ghost hint |
| Escape | Exit find / close suggestions |
Widgets
The Browser Inspector widget appears when a Browser tab is active. It contains three collapsible sections: Inspector, Capture, and Viewport.
How widgets are laid out across the app is covered in the Widgets documentation.
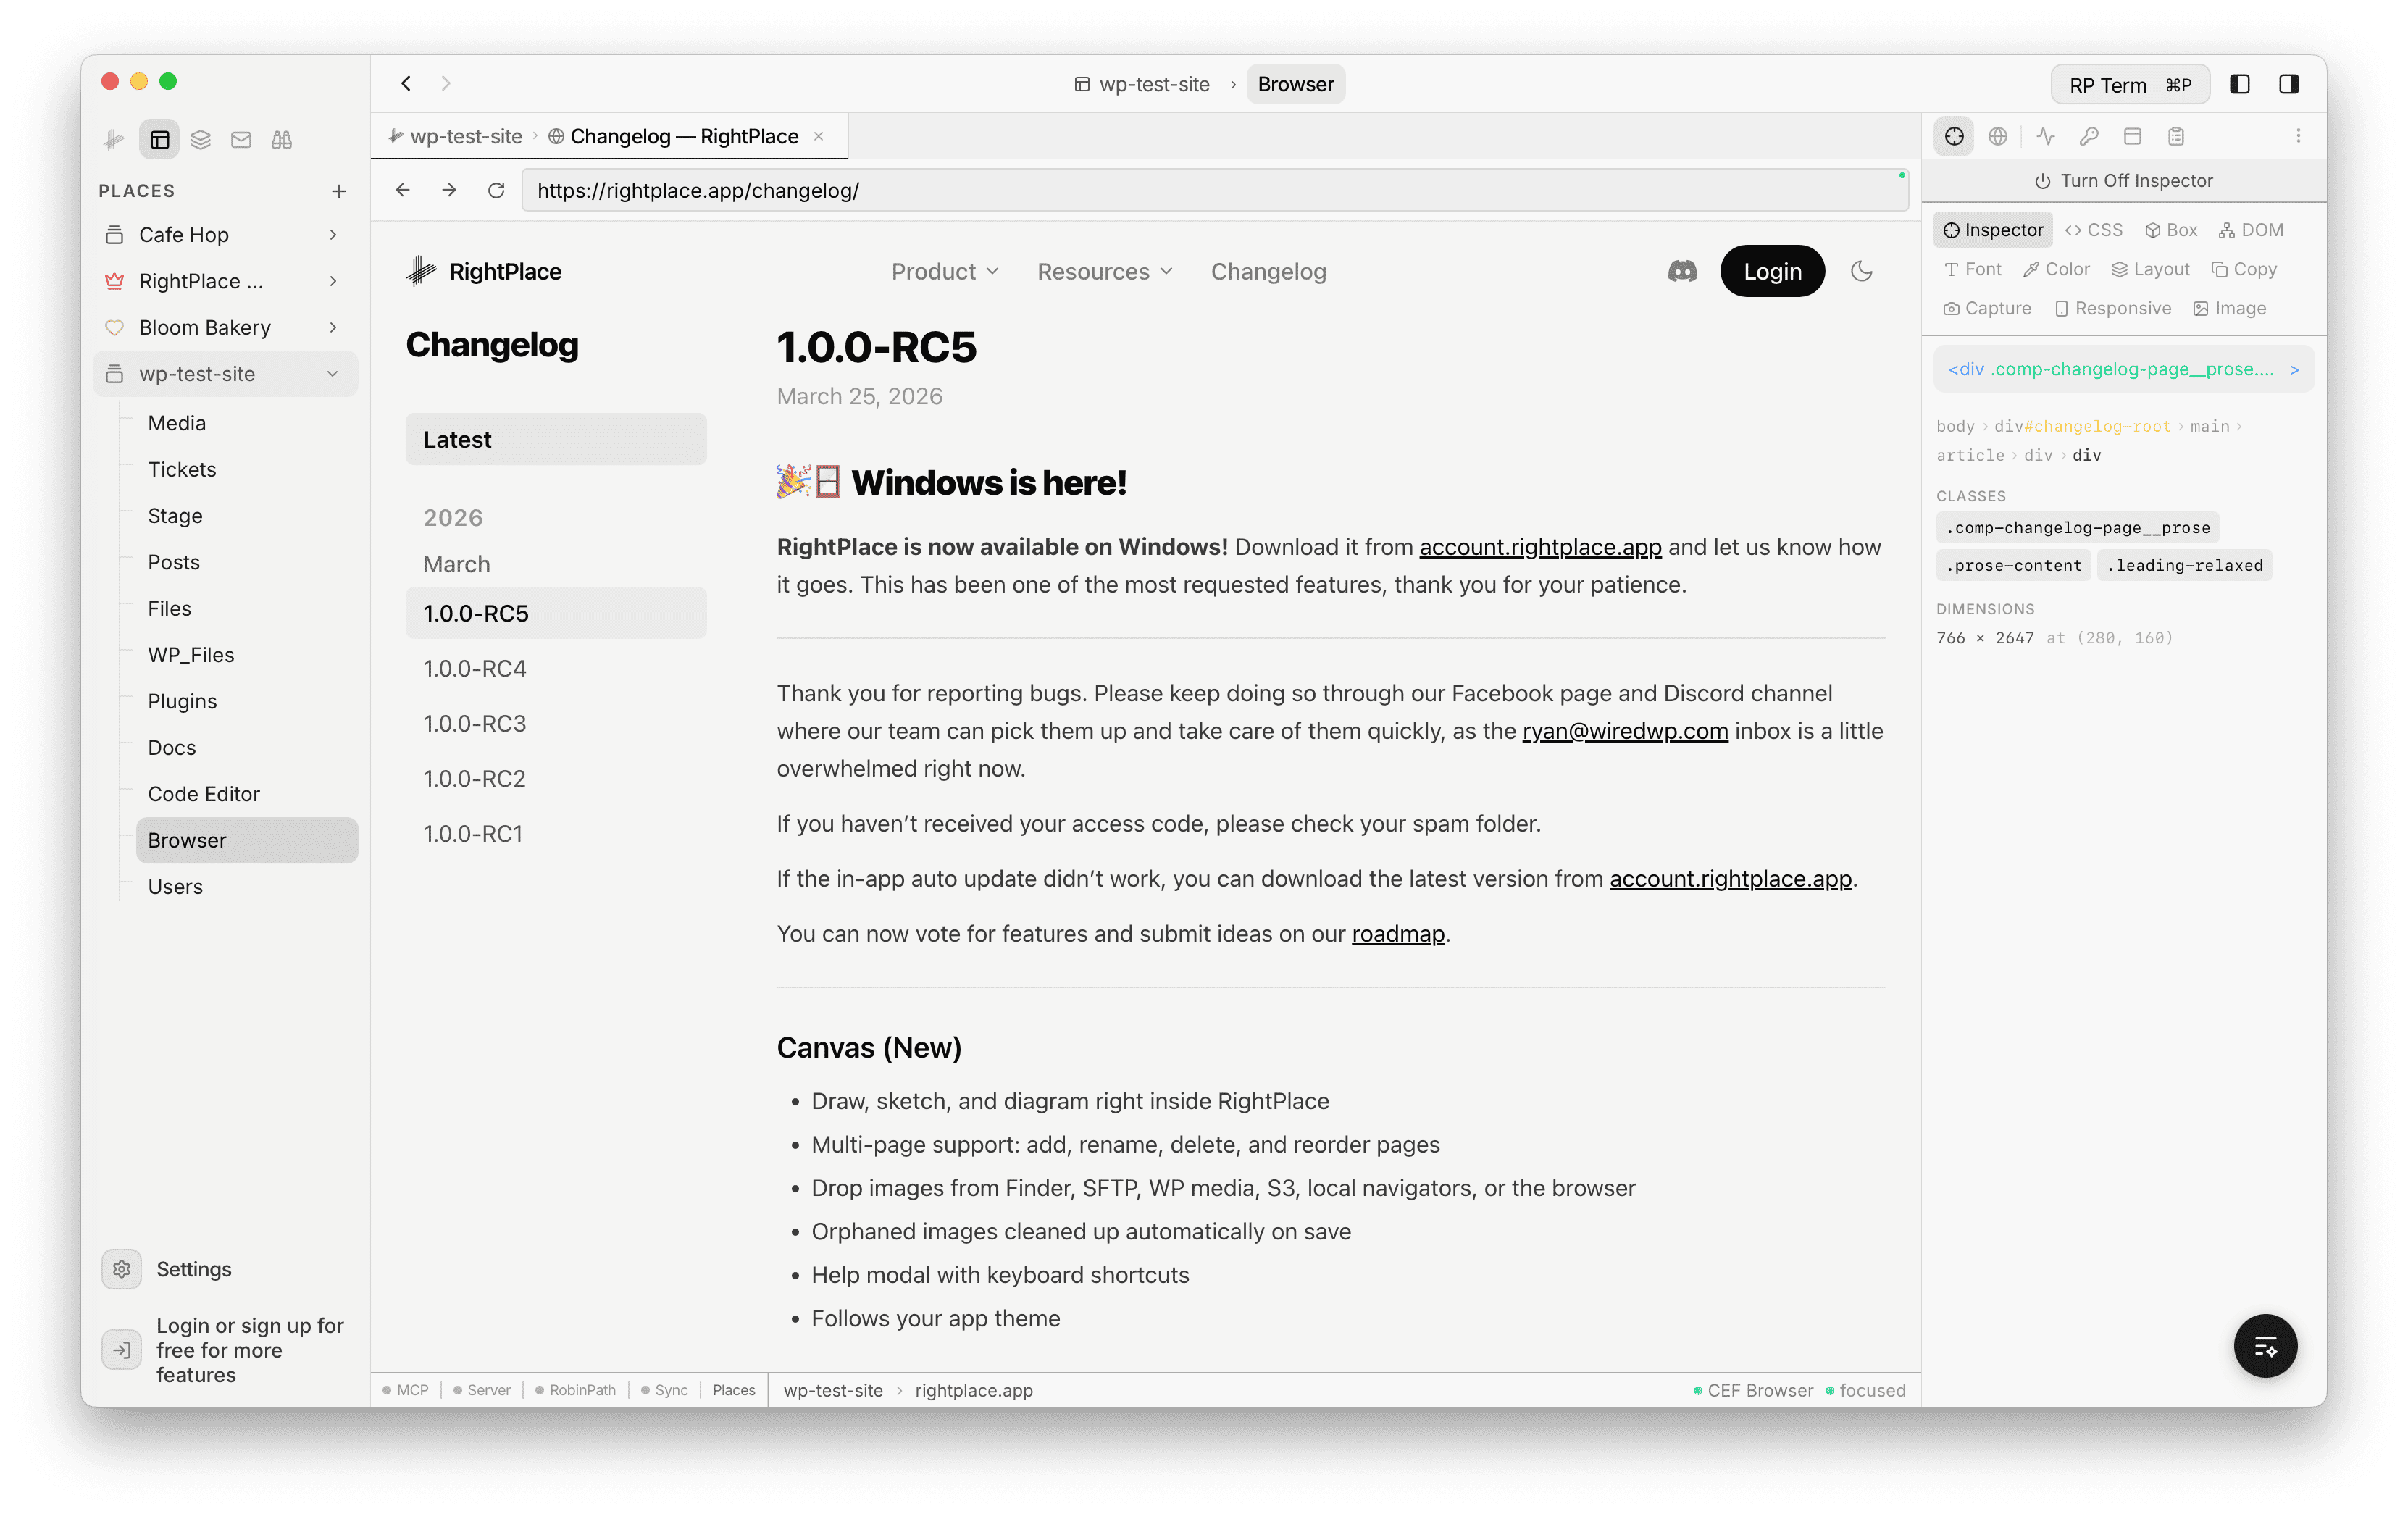
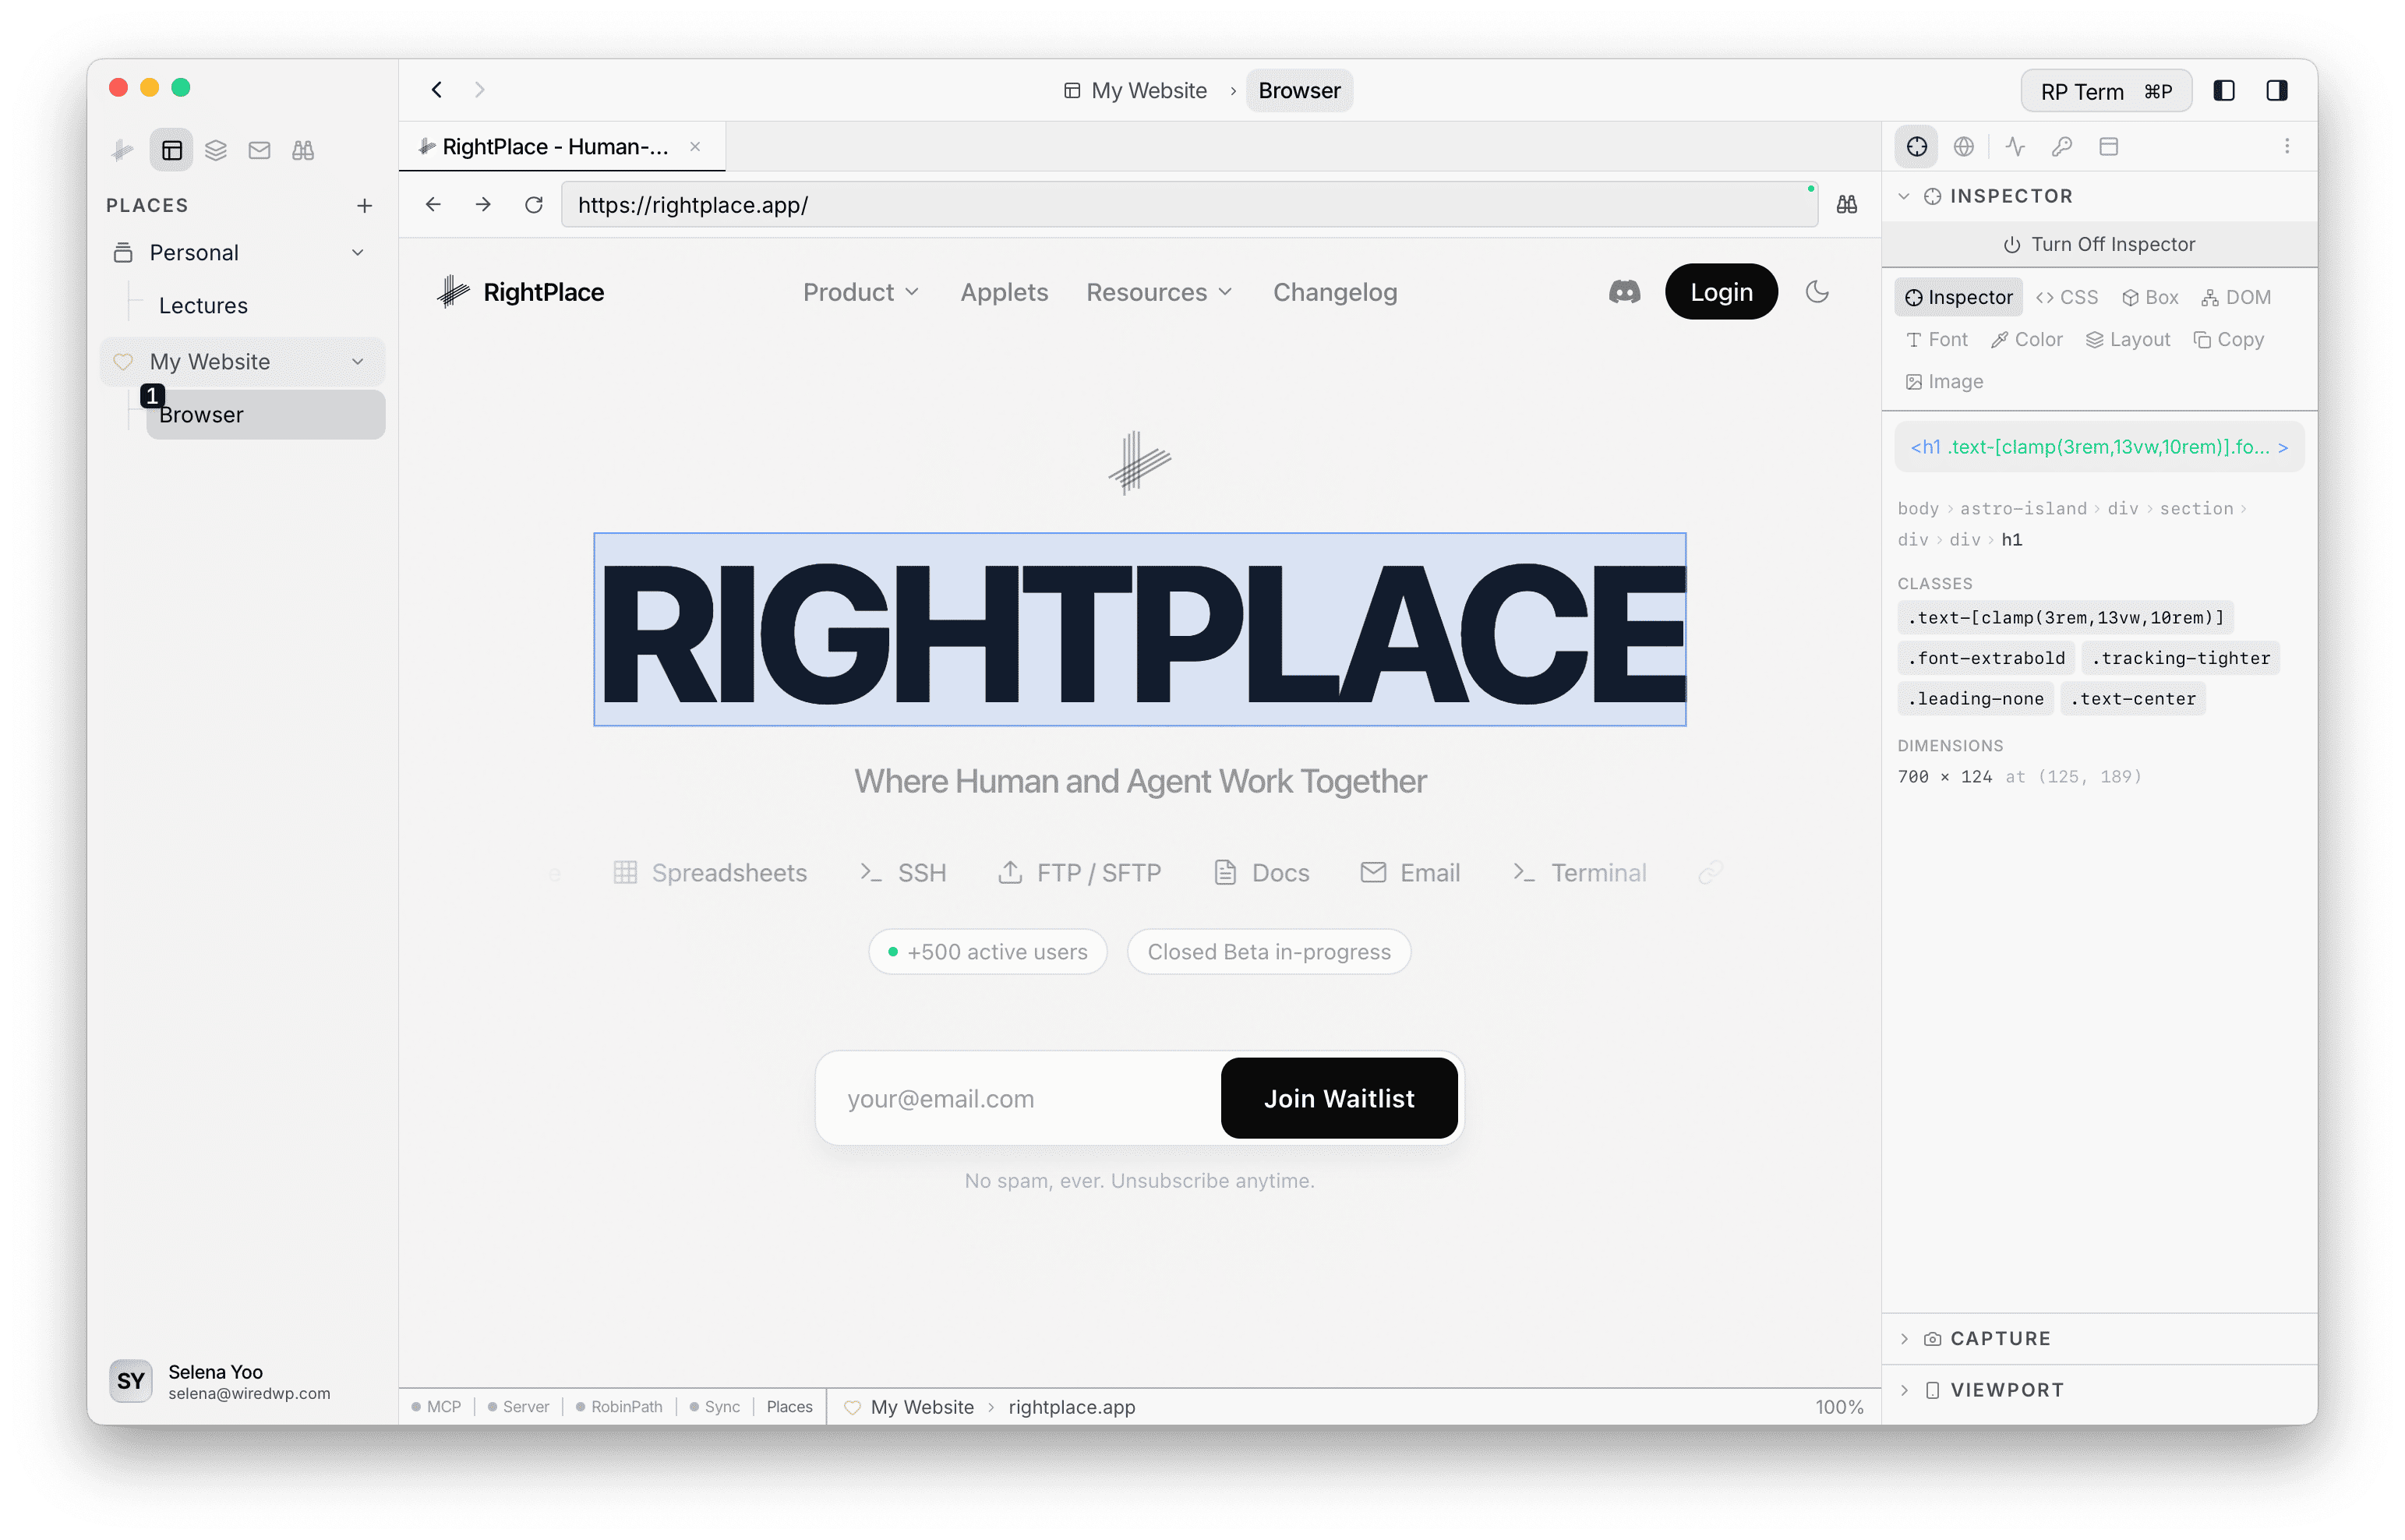
Inspector
The Inspector section is for picking elements and reading structure and styles. Turn the Inspector on or off with the power control at the top. When it is on, hovering over the page highlights elements with an overlay (tag, ID, classes). Click to select and lock an element for the active tool. You can also start inspection from the page context menu (RightPlace Inspector) or use Cmd+Shift+C for pick mode (see Keyboard shortcuts).
The Inspector toolbar lists nine tools:
| Tool | Description |
|---|---|
| Inspector | Click any element to select and inspect it |
| CSS | View computed CSS properties of the selected element |
| Box | Visualize the CSS box model (margin, border, padding, content) |
| DOM | Navigate the document structure as a tree |
| Font | Inspect typography and font properties |
| Color | Pick any color from an element on the page |
| Layout | Toggle grid and flexbox overlay visualization |
| Copy | Copy selectors, HTML, or attributes of the selected element |
| Image | Inspect image dimensions, alt text, and format |
Capture
The Capture section is dedicated to screenshots and is independent of which Inspector tool is selected.
Modes:
- Visible: captures the current viewport as shown on screen
- Full Page: captures the entire page by scrolling through its full height
- Region: click and drag on the page to select a custom rectangular area
- Selected: appears when an element is already selected in the Inspector; captures that element
After capturing, a preview thumbnail is shown. You can Save the screenshot as a PNG file or Copy it to the clipboard.
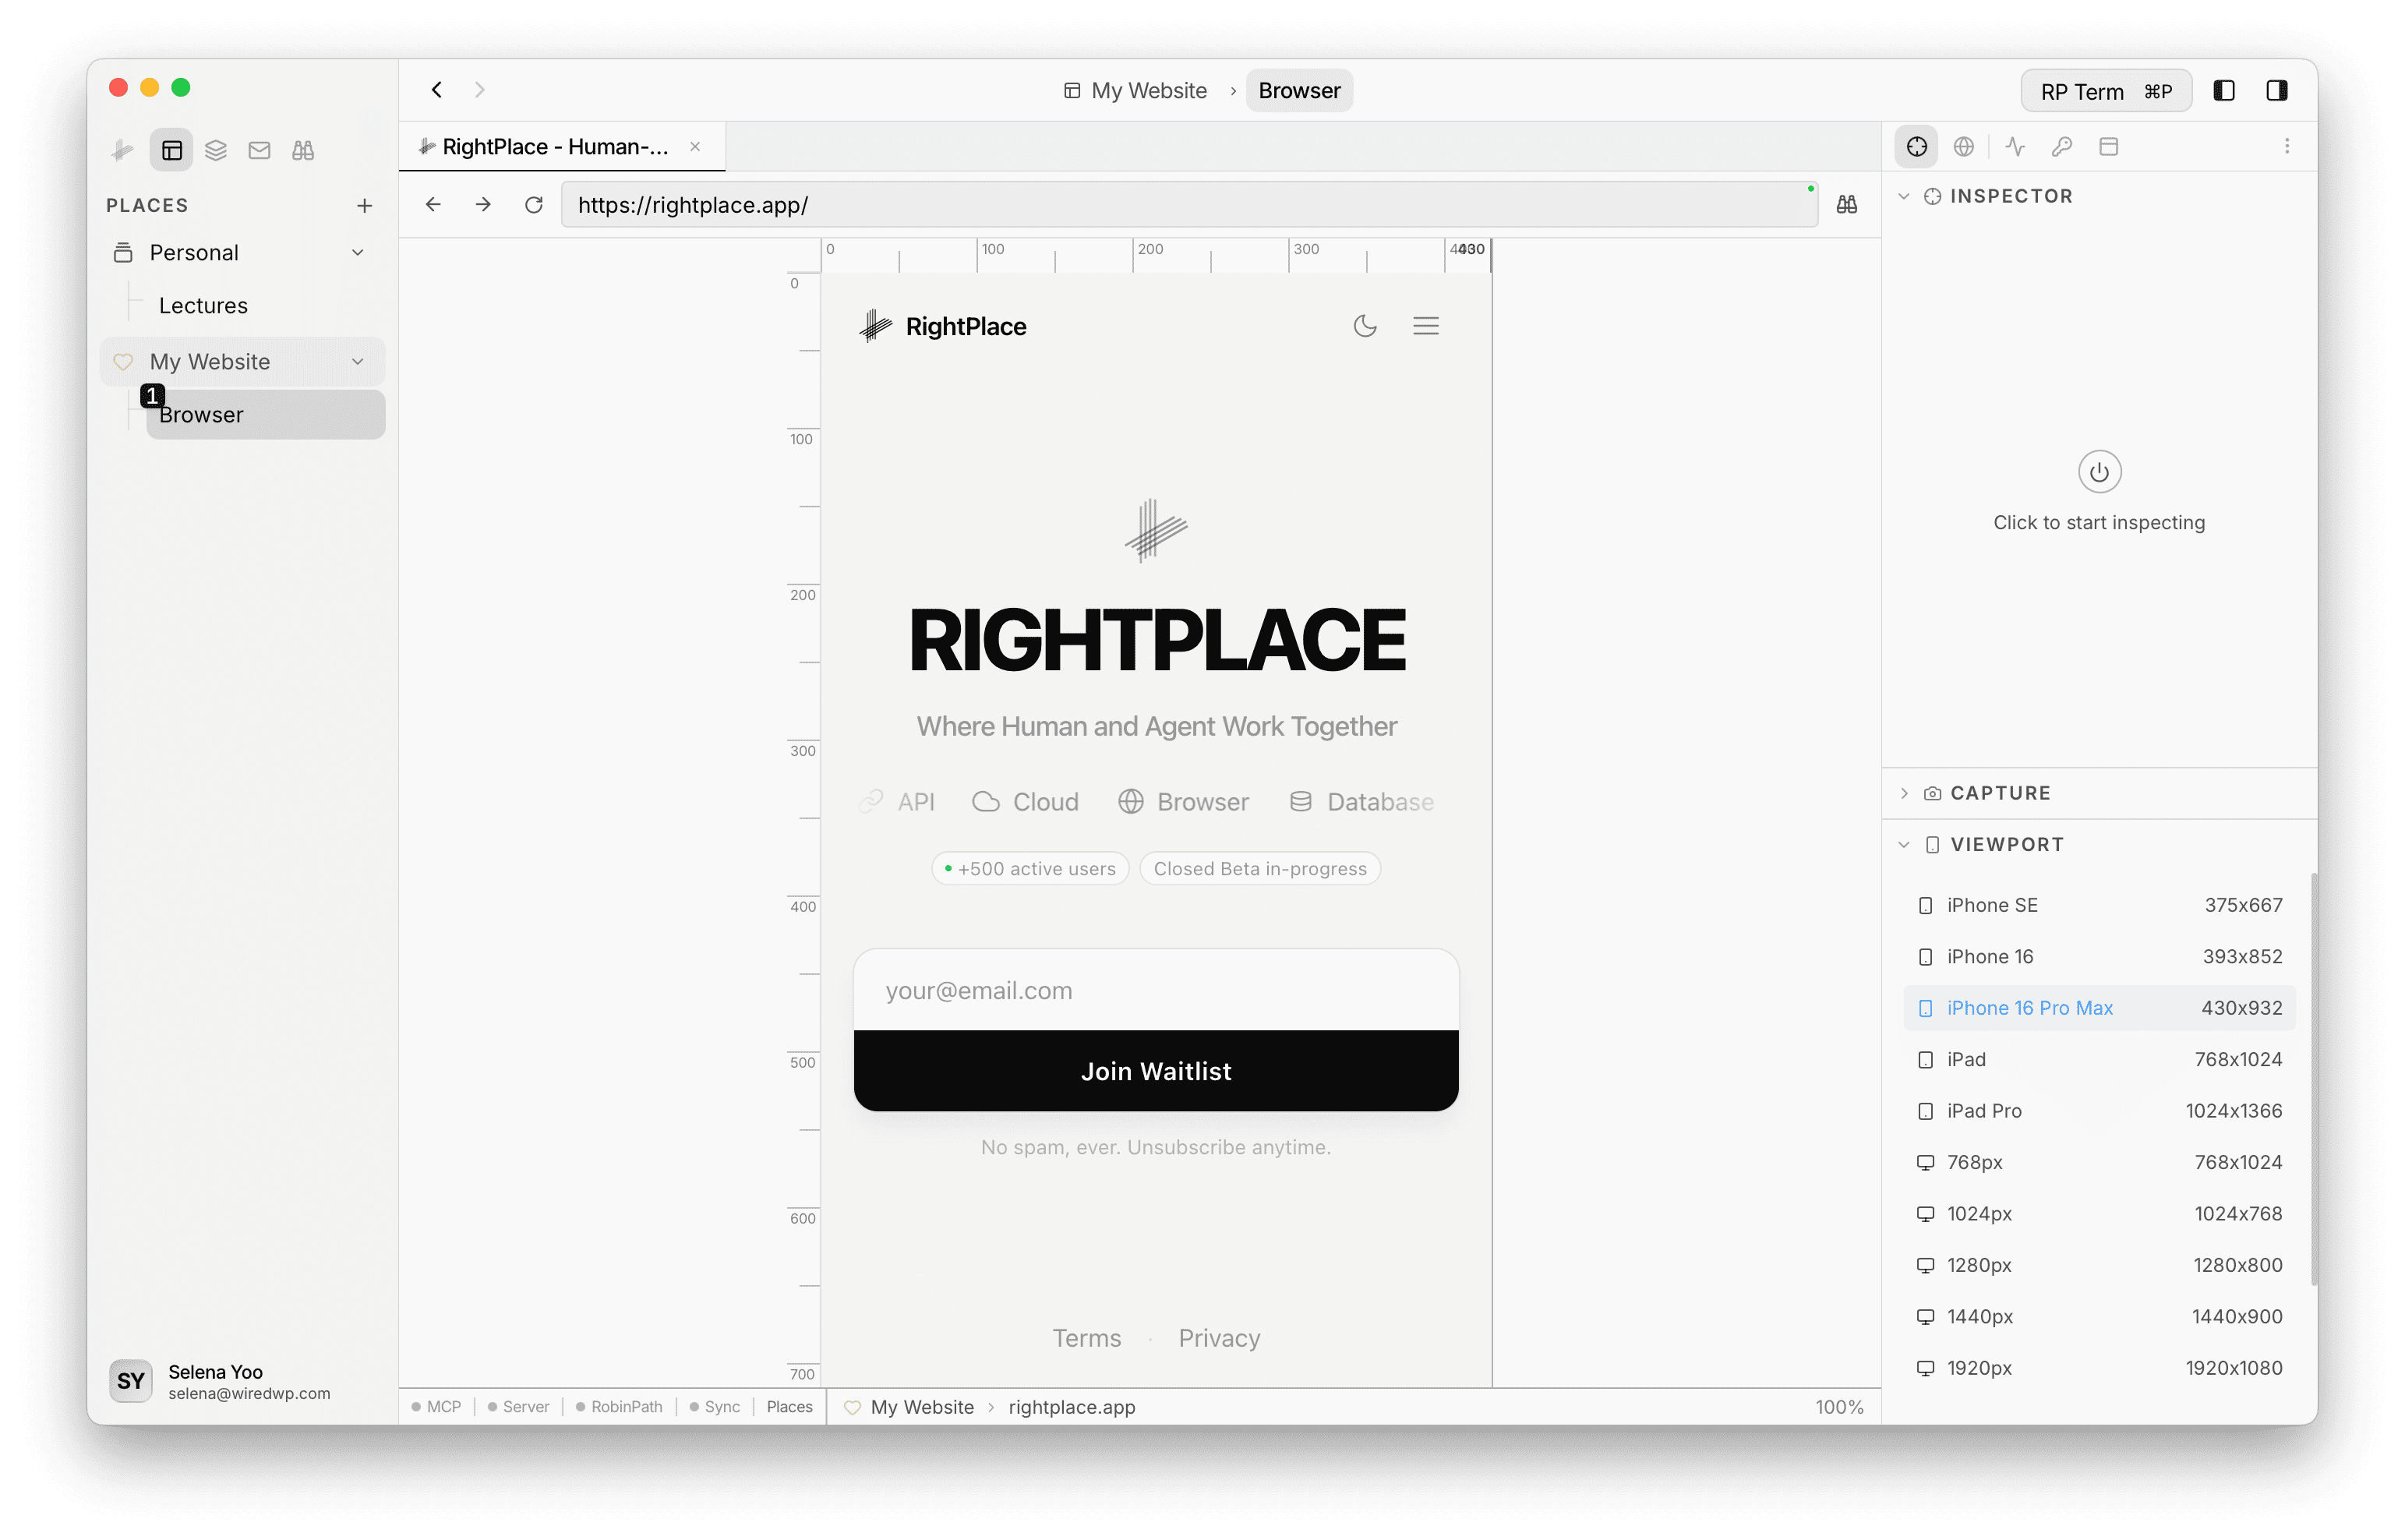
Viewport
The Viewport section resizes the in-app browser so you can preview the page at specific dimensions.
Device presets include:
- iPhone SE: 375 x 667
- iPhone 16: 393 x 852
- iPhone 16 Pro Max: 430 x 932
- iPad: 768 x 1024
- iPad Pro: 1024 x 1366
- 768px: 768 x 1024
- 1024px: 1024 x 768
- 1280px: 1280 x 800
- 1440px: 1440 x 900
- 1920px: 1920 x 1080
You can also enter a custom width and height. When the viewport is larger than the available space, zoom-to-fit adjusts automatically. Horizontal and vertical pixel rulers appear along the edges for reference.
Related: If the project has a WordPress site connected, you usually open it from the Place Browser tab or from the WordPress resource. How login, the vault, sessions, and
/wp-adminpaths work together is covered on the WordPress Site page. To add a site or fix pairing, use Connecting a WordPress site.
Next steps
- Website: Save a collection of URLs as a persistent applet with bookmarks and folders
- WordPress: Connect and manage WordPress sites
- Image Editor: Edit images with professional-grade tools